Area PPT Chart Diagram
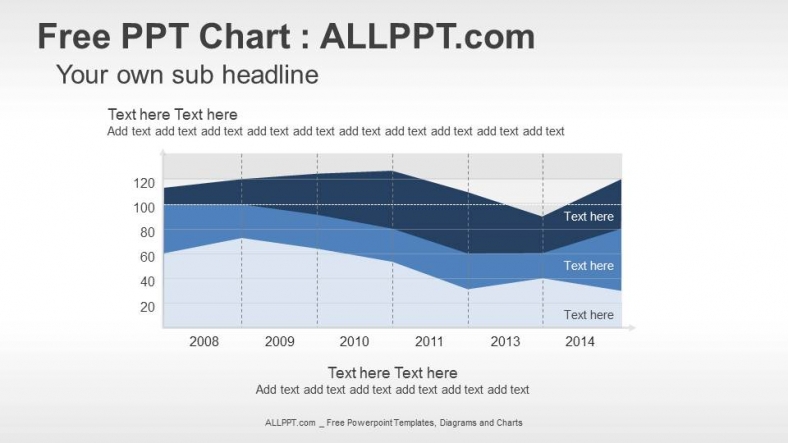
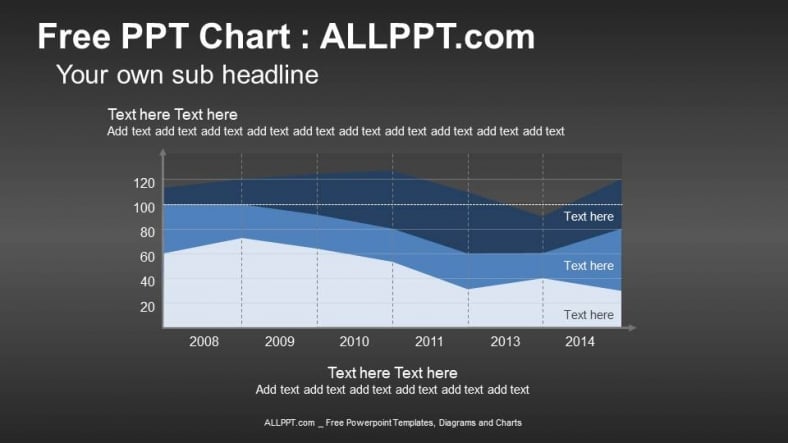
Area PPT Chart Diagram is a easy however helpful house chart template for Microsoft PowerPoint presentations with arrows.
Area PPT Chart Diagram is can be customized in color and size, text, position of graphics and change the background style.
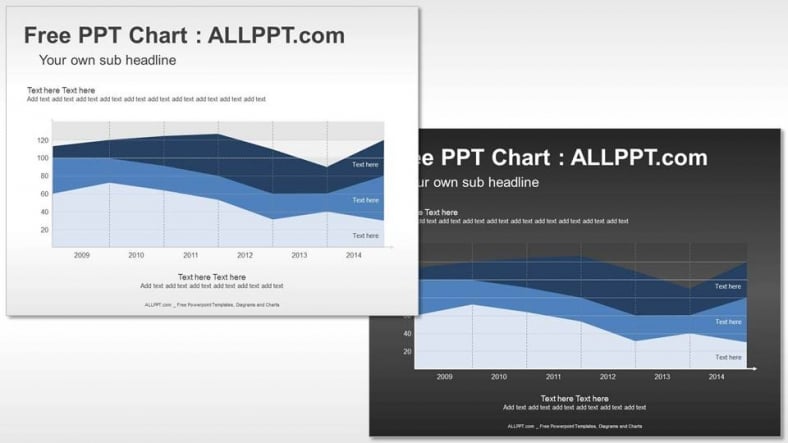
Widescreen(16:9) : include 2 backgrounds and 2 slides.
Standard(4:3) : include 2 backgrounds and 2 slides.
Standard(4:3) : include 2 backgrounds and 2 slides.
Search Keyword : Area, chart, circle, computer, design, diagram, digital, globe, graphic, grid, hazard, industry
All our PowerPoint Charts are free. If you use one, please say thanks by sharing via Google+1, Twitter, or Facebook. Very Thanks !!
Area PPT Chart Diagram
Widescreen(16:9)
Area PPT Chart Diagram
Standard(4:3)
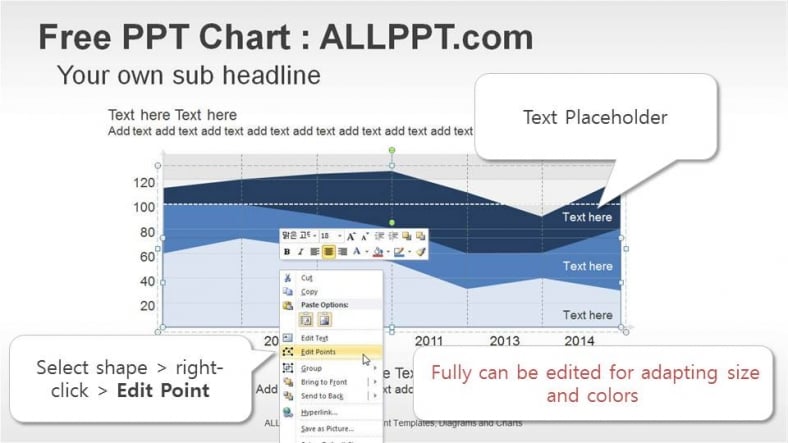
How to Modify
Download Widescreen(16:9) : Area-PPT-Chart-Diagram-Widescreen
Download Standard(4:3) : Area-PPT-Chart-Diagram-Standard
You May Also Like


Leave a Reply
Want to join the discussion?Feel free to contribute!