Half Sized Blog Element (Single Author Style)
Half Sized Blog Element (Multi Author Style)
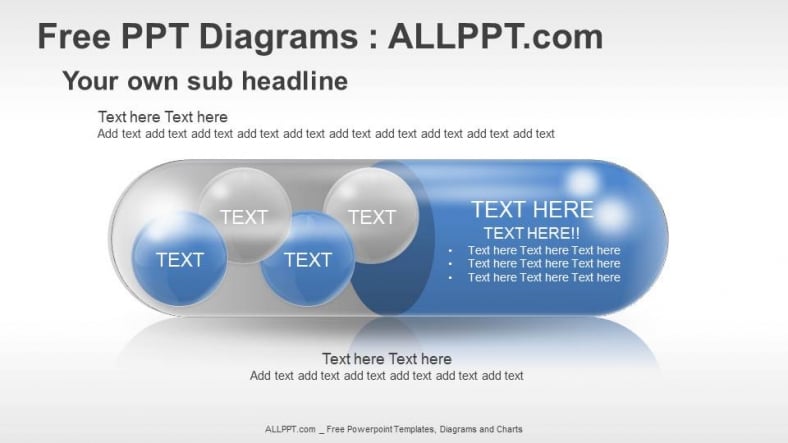
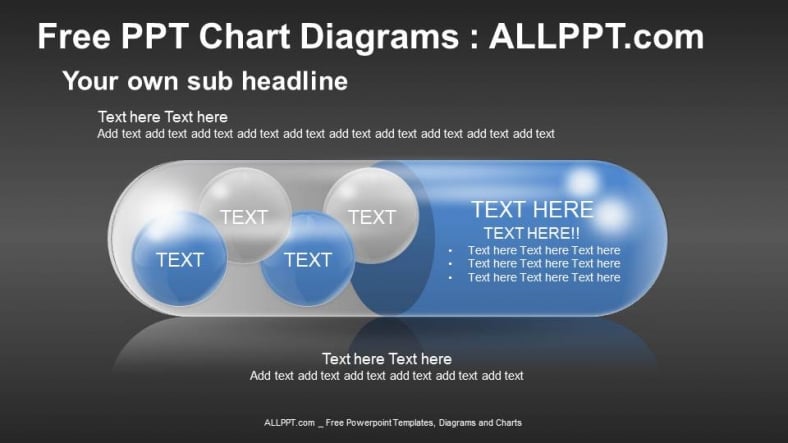
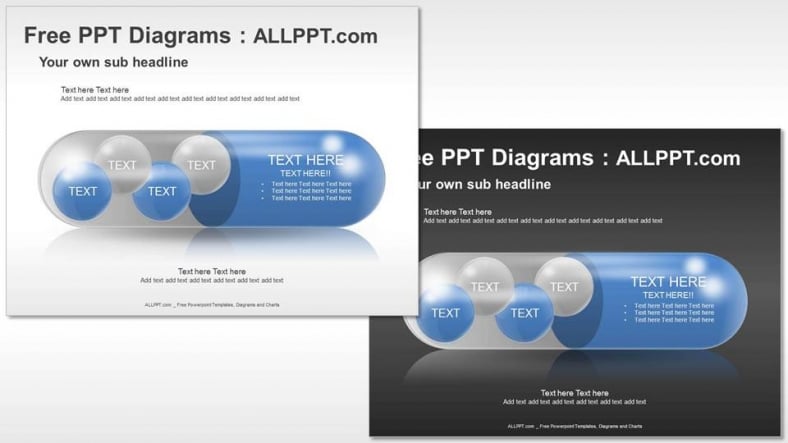
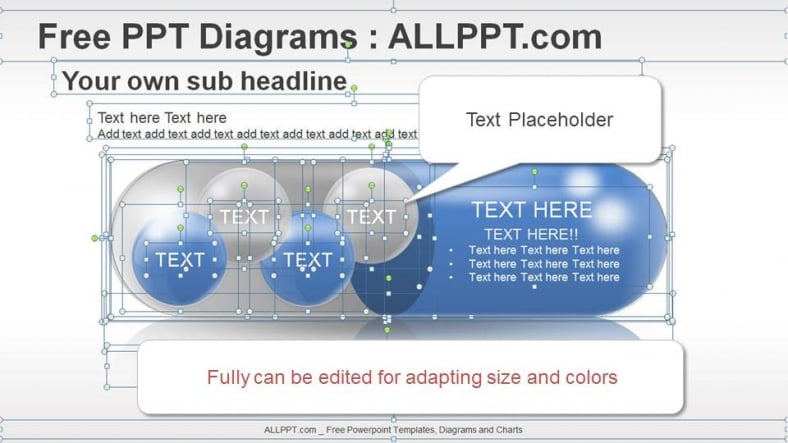
Free Pills Graphic PPT Diagrams
/22 Comments/in Powerpoint Graphic Diagrams, PPT Charts /by adminaeFree, Pills, Graphic, PPT, Diagrams, healthy, illness, lifestyle, macro, med, medical, medicine, pharmacology, pharmacy, pill, prescription, protection, refill Widescreen(16:9) : 2 background , 2 internal slide Standard(4:3) : 2 background , 2 internal slide Free Pills Graphic PPT Diagrams is can be customized in color and size, text, position of graphics and change the […]
Free Grey Abstract Powerpoint Templates
/0 Comments/in Abstract PPT Templates, Blue PPT, Mordern PPT, PPT Templates /by adminaeFree, Grey, Abstract, Powerpoint, Templates, creative, curve, design, digital, dynamic, elegant, flow, flowing, fractal, futuristic, gradient, graphic, gray, grey, illustrated, illustration, light, lines, modern, pattern, style Widescreen(16:9) : 1 master background , 1 internal slide Standard(4:3) : 1 master background , 1 internal slide Free Grey Abstract Powerpoint Templates is can be customized in color […]