Posts

Placemark Point PowerPoint Diagram

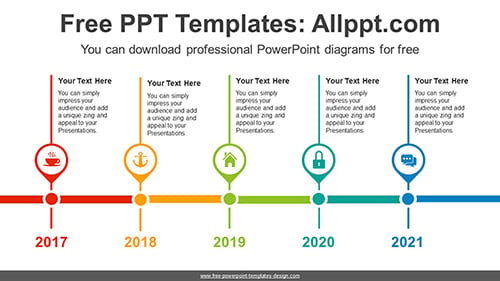
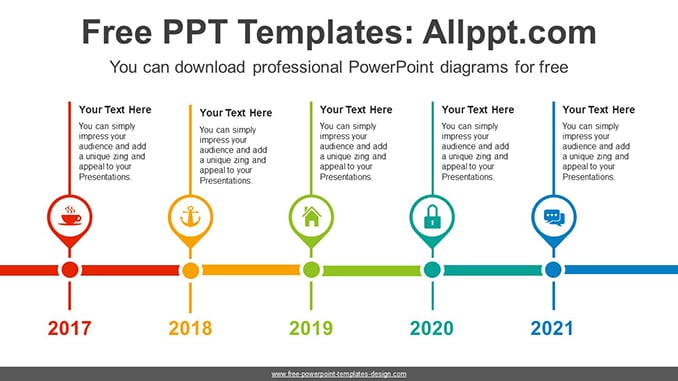
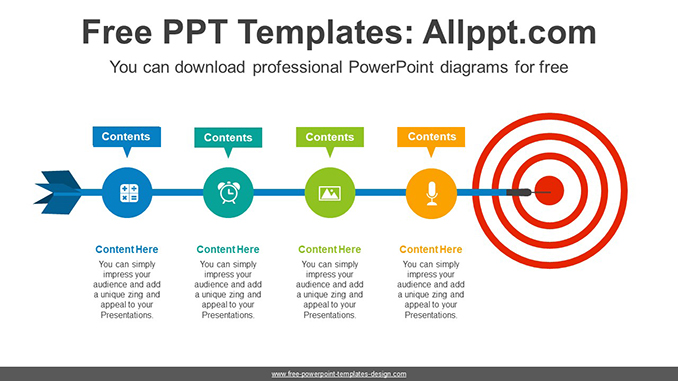
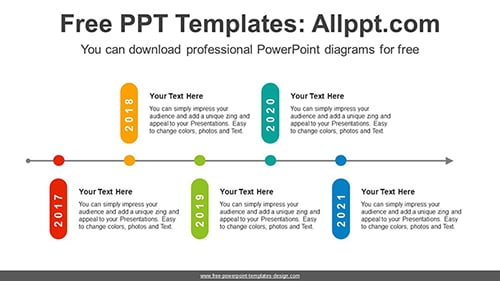
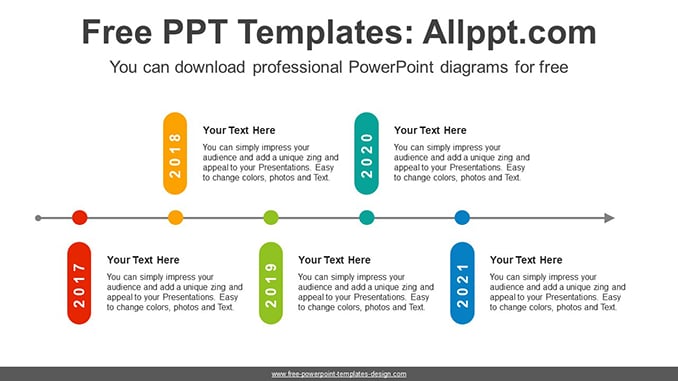
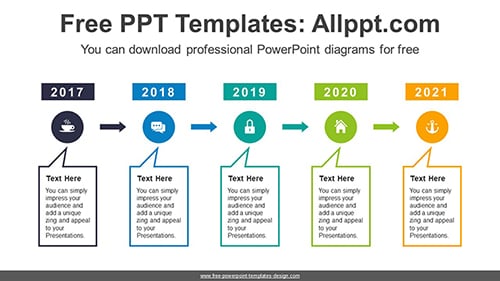
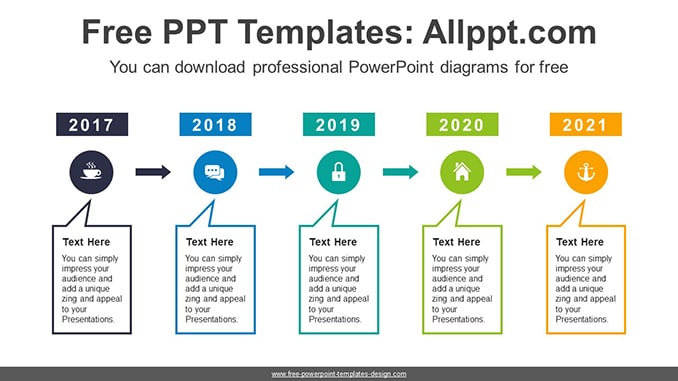
This diagram is a placemark point design on thin bar lines. This colorful placemark point allows you to visualize the passage of time. It’s also an editable graphic with text and icon placeholders.

Search Keywords: diagram, template, presentation, infographic, graph, graphic, data, design, process, progress, set, shape, step, symbol, concept, connection, creative, editable, timeline, line, simple, circles, colorful, placemark, point, thin, bar, line

Placemark Point PowerPoint Diagram

This PowerPoint diagram template has theme color applied. So when you do simple copying and pasting, the color will be applied automatically. In addition, shapes and text are 100% editable

This ‘Placemark Point PowerPoint Diagram’ Preview:

This template can be used for school classes, business purposes, and commercial purposes. However, this template cannot be distributed absolutely.

You May Also Like

Paint Worker Bar Chart PowerPoint Diagram

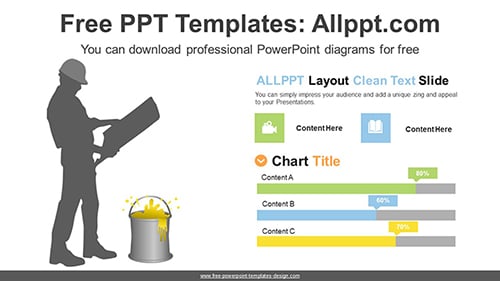
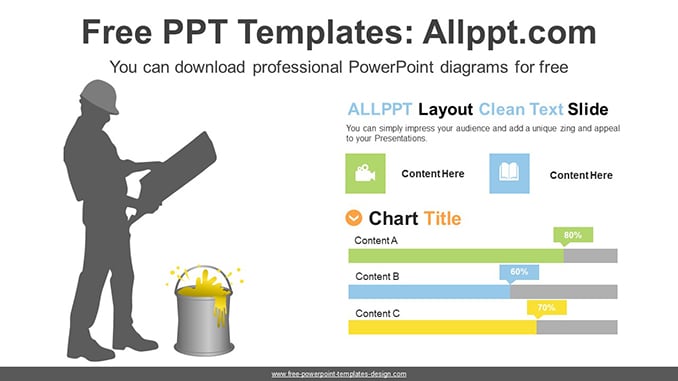
This diagram is a bar chart with a paint worker illustration. This makes it easy to describe your data with simple charts and text lists. It’s also an editable graphic for text, chart, and icon placeholders.

Search Keywords: template, presentation, graph, icons, infographic, information, idea, graphic, data, design, process, progress, shape, step, concept, connection, creative, connected, editable, analysis, analyze, audit, business, chart, element, management, part, report, research, result, statistics, stats, table, vertical, bar, vertical, column, Illustration, silhouette, paint, worker

Paint Worker Bar Chart PowerPoint Diagram

This PowerPoint diagram template has theme color applied. So when you do simple copying and pasting, the color will be applied automatically. In addition, shapes and text are 100% editable

This ‘Paint Worker Bar Chart PowerPoint Diagram’ Preview:

This template can be used for school classes, business purposes, and commercial purposes. However, this template cannot be distributed absolutely.

You May Also Like

Archery Arrow Progress PowerPoint Diagram

This diagram is an archery target and arrow infographic design. Arrows and circles pointing towards the target indicate the progress or flow of the task. It’s also an editable graphic with text and icon placeholders.

Search Keywords: diagram, template, presentation, graph, icons, infographic, information, idea, layout, graph, graphic, data, design, process, progress, set, shape, step, success, symbol, sign, concept, connection, creative, planning, connected, editable, 3D, archery, target, arrow, circle, speech bubble, bar

Archery Arrow Progress PowerPoint Diagram

This PowerPoint diagram template has theme color applied. So when you do simple copying and pasting, the color will be applied automatically. In addition, shapes and text are 100% editable

This ‘Archery Arrow Progress PowerPoint Diagram’ Preview:

This template can be used for school classes, business purposes, and commercial purposes. However, this template cannot be distributed absolutely.

You May Also Like

Rocket Column Chart PowerPoint Diagram

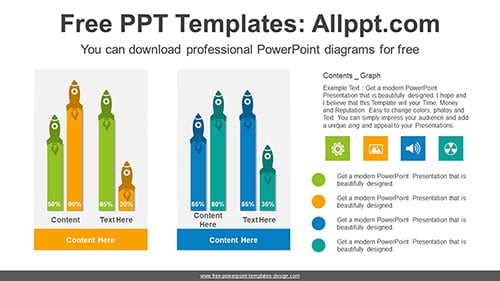
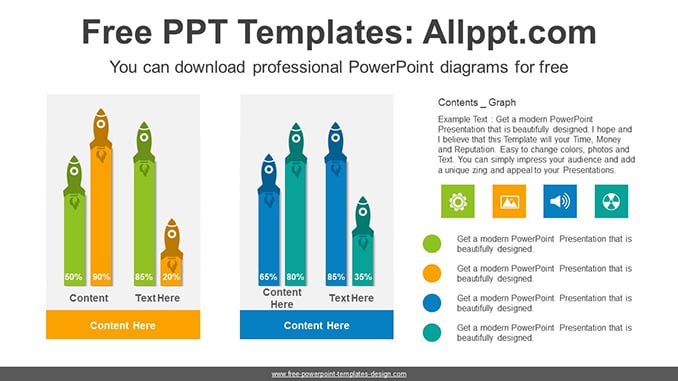
This diagram is a column chart for comparing two pieces of data. This diagram visualizes the increase in numbers using a rocket. This column chart can easily adjust numeric values with formula inputs.

Search Keywords: diagram, template, presentation, graph, graphic, icons, infographic, information, idea, layout, data, design, process, progress, shape, step, symbol, concept, connection, creative, editable, analysis, analyze, audit, business, chart, element, part, report, research, result, statistics, stats, stacked, vertical, bar, column, rocket

Rocket Column Chart PowerPoint Diagram

This PowerPoint diagram template has theme color applied. So when you do simple copying and pasting, the color will be applied automatically. In addition, shapes and text are 100% editable

This ‘Rocket Column Chart PowerPoint Diagram’ Preview:

This template can be used for school classes, business purposes, and commercial purposes. However, this template cannot be distributed absolutely.

You May Also Like

Oil Crisis Chart PowerPoint Diagram

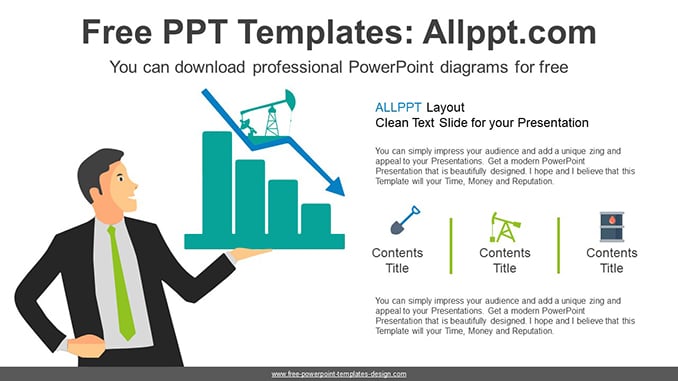
This diagram is an illustrated design of a chart decline in the oil crisis. A businessman shows a downtrend chart of the oil market. It’s also an editable graphic with text and icon placeholders.

Search Keywords: diagram, template, presentation, graph, graphic, icons, infographic, information, idea, layout, data, design, process, progress, shape, step, symbol, concept, connection, creative, editable, rise, staircase, up, growth, four, arrow, oil, crisis, staircase, tank, barrel, banner, market, chart, bar, illustration, businessman

Oil Crisis Chart PowerPoint Diagram

This PowerPoint diagram template has theme color applied. So when you do simple copying and pasting, the color will be applied automatically. In addition, shapes and text are 100% editable

This ‘Oil Crisis Chart PowerPoint Diagram’ Preview:

This template can be used for school classes, business purposes, and commercial purposes. However, this template cannot be distributed absolutely.

You May Also Like

Line-Column Combo PowerPoint Diagram

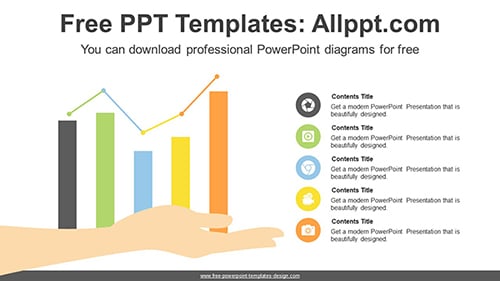
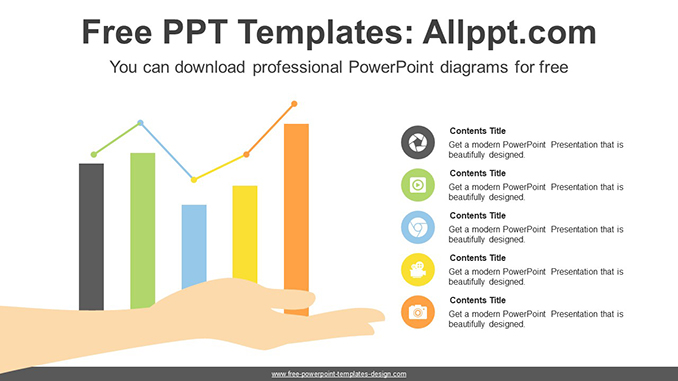
This diagram is a vertical Column-line combo chart. This makes it easy to adjust numeric values by entering a formula. It’s also an editable graphic for text, charts and icon placeholders.

Search Keywords: template, presentation, graph, icons, infographic, information, idea, graphic, data, design, process, progress, shape, step, concept, connection, creative, connected, editable, analysis, analyze, audit, business, chart, element, management, part, report, research, result, statistics, stats, table, vertical, bar, vertical, column, line, combo, hand, Illustration, silhouette

Line-Column Combo PowerPoint Diagram

This PowerPoint diagram template has theme color applied. So when you do simple copying and pasting, the color will be applied automatically. In addition, shapes and text are 100% editable

This ‘Line-Column Combo PowerPoint Diagram’ Preview:

This template can be used for school classes, business purposes, and commercial purposes. However, this template cannot be distributed absolutely.

You May Also Like

Rounded Text Box PowerPoint Diagram

This template is a harmonious text box design. You can visualize the passage of time using text boxes and thin bar. It’s also an editable graphic with text and icon placeholders.

Search Keywords:PowerPoint, diagram, template, presentation, infographic, graph, graphic, data, design, process, progress, set, shape, step, symbol, concept, connection, creative, editable, timeline, line, simple, text boxes, thin, bar, colorful

Rounded Text Box PowerPoint Diagram

This PowerPoint diagram template has theme color applied. So when you do simple copying and pasting, the color will be applied automatically. In addition, shapes and text are 100% editable

This ‘Rounded Text Box PowerPoint Diagram’ Preview:

This template can be used for school classes, business purposes, and commercial purposes. However, this template cannot be distributed absolutely.

You May Also Like

Truck Icon Bar Chart PowerPoint Diagram

This diagram is a bar chart with a truck icon. This makes it easy to describe your data with simple charts and text lists. Bar charts allow you to easily adjust numeric values by entering formulas.

Search Keywords: PowerPoint, diagram, template, presentation, graph, graphic, icons, infographic, information, design, shape, creative, editable, analysis, analyze, audit, business, chart, part, report, research, statistics, stats, column, car, truck, chart, bar

Truck Icon Bar Chart PowerPoint Diagram

This PowerPoint diagram template has theme color applied. So when you do simple copying and pasting, the color will be applied automatically. In addition, shapes and text are 100% editable

This ‘Truck Icon Bar Chart PowerPoint Diagram’ Preview:

This template can be used for school classes, business purposes, and commercial purposes. However, this template cannot be distributed absolutely.

You May Also Like

Speech Bubble List PowerPoint Diagram

This diagram is a design that arranges a speech bubble and a circle. You can create a variety of visual effects through circle and year bars and speech bubble banners. It’s also an editable graphic with text and icon placeholders.

Search Keywords: PowerPoint, diagram, template, presentation, infographic, graph, graphic, data, design, process, progress, set, shape, step, symbol, concept, connection, creative, editable, timeline, line, simple, speech bubble, circle, banner, bar

Speech Bubble List PowerPoint Diagram

This PowerPoint diagram template has theme color applied. So when you do simple copying and pasting, the color will be applied automatically. In addition, shapes and text are 100% editable

This ‘Speech Bubble List PowerPoint Diagram’ Preview:

This template can be used for school classes, business purposes, and commercial purposes. However, this template cannot be distributed absolutely.

You May Also Like

Real Estate Vertical Bar Chart PPT Diagram

This diagram is a house-shaped vertical bar chart. This is a great way to visually represent the rise and fall of real estate. Bar charts can easily adjust numeric values by entering formulas.

Search Keywords: template, presentation, graph, icons, infographic, information, idea, graphic, data, design, process, progress, shape, step, concept, connection, creative, connected, editable, analysis, analyze, audit, business, chart, element, management, part, report, research, result, statistics, stats, table, vertical, bar, house, real estate, vertical

Real Estate Vertical Bar Chart PPT Diagram

This PowerPoint diagram template has theme color applied. So when you do simple copying and pasting, the color will be applied automatically. In addition, shapes and text are 100% editable

This ‘Real Estate Vertical Bar Chart PPT Diagram’ Preview:

This template can be used for school classes, business purposes, and commercial purposes. However, this template cannot be distributed absolutely.

You May Also Like