Posts

Horizontal Symmetry Bar Chart PPT Diagram

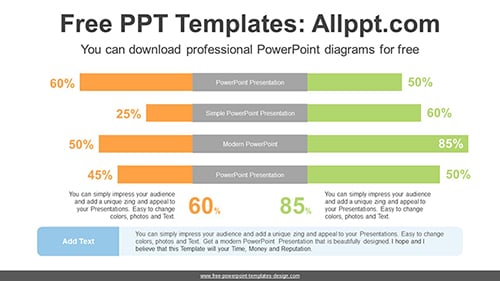
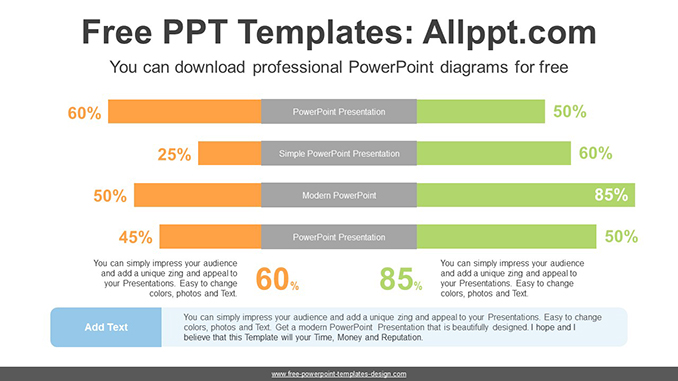
This diagram is a design that compares and explains the horizontal bar chart symmetrically. This allows you to modify the data with simple numeric adjustments.

Search Keywords: PowerPoint, diagram, template, presentation, graph, graphic, icons, infographic, information, idea, layout, data, design, process, progress, shape, step, symbol, concept, connection, creative, editable, analysis, analyze, audit, business, chart, element, management, part, report, research, result, statistics, stats, explains, compares, horizontal, bar, symmetrically

Horizontal Symmetry Bar Chart PPT Diagram

This PowerPoint diagram template has theme color applied. So when you do simple copying and pasting, the color will be applied automatically. In addition, shapes and text are 100% editable

This ‘Horizontal Symmetry Bar Chart PPT Diagram’ Preview:

This template can be used for school classes, business purposes, and commercial purposes. However, this template cannot be distributed absolutely.

You May Also Like

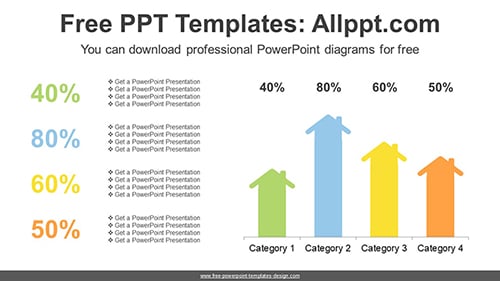
Car Icon Bar Chart PowerPoint Diagram

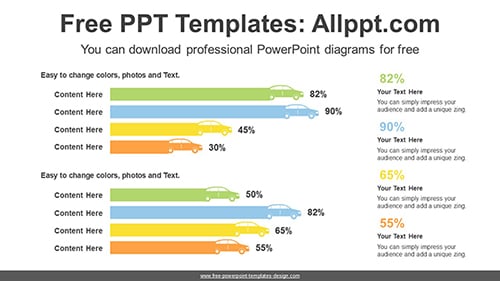
This diagram is a bar chart with a car icon. This makes it easy to describe your data with simple charts and text lists. Bar charts allow you to easily adjust numeric values by entering formulas.

Search Keywords: PowerPoint, diagram, template, presentation, graph, graphic, icons, infographic, information, design, shape, creative, editable, analysis, analyze, audit, business, chart, part, report, research, statistics, stats, column, car, chart, bar

Car Icon Bar Chart PowerPoint Diagram

This PowerPoint diagram template has theme color applied. So when you do simple copying and pasting, the color will be applied automatically. In addition, shapes and text are 100% editable

This ‘Car Icon Bar Chart PowerPoint Diagram’ Preview:

This template can be used for school classes, business purposes, and commercial purposes. However, this template cannot be distributed absolutely.
You May Also Like

Comparison Thermometer Chart PowerPoint Diagram

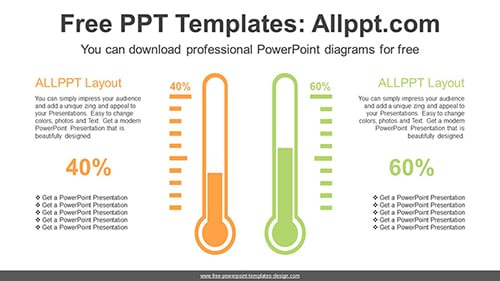
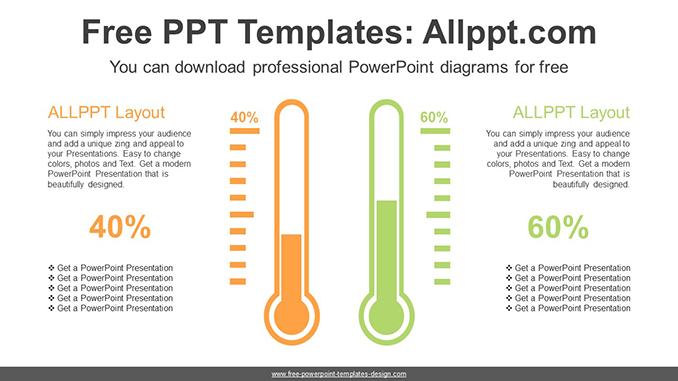
This diagram is a thermometer bar chart comparing the two types. These bar charts help you visualize comparisons, such as two variations, growth rates. You can also modify data with simple formula input.

Search Keywords: PowerPoint, diagram, template, presentation, graph, graphic, icons, infographic, information, design, shape, creative, editable, analysis, analyze, audit, business, chart, part, report, research, statistics, stats, column, thermometer, chart, bar, comparing

Comparison Thermometer Chart PowerPoint Diagram

This PowerPoint diagram template has theme color applied. So when you do simple copying and pasting, the color will be applied automatically. In addition, shapes and text are 100% editable

This ‘Comparison Thermometer Chart PowerPoint Diagram’ Preview:

This template can be used for school classes, business purposes, and commercial purposes. However, this template cannot be distributed absolutely.
You May Also Like

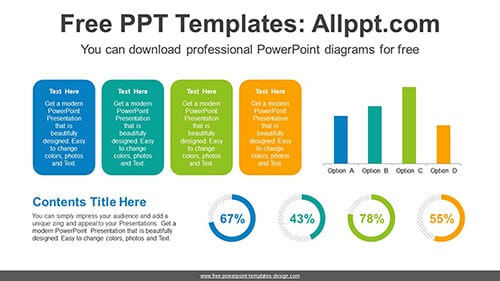
Comparative Complex Chart PowerPoint Diagram

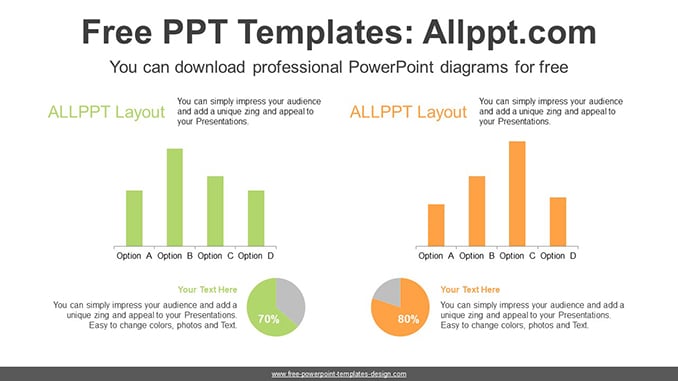
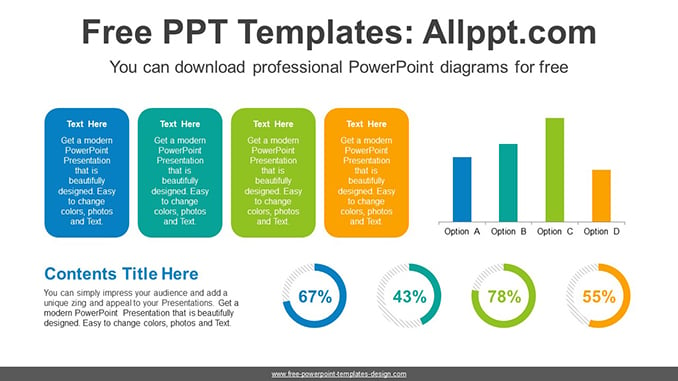
This diagram is a composite chart comparing the two types. This makes it easy to describe your data with simple charts and text lists. Bar charts allow you to easily adjust numeric values by entering formulas.

Search Keywords: PowerPoint, diagram, template, presentation, graph, graphic, icons, infographic, information, idea, layout, data, design, process, progress, shape, step, symbol, concept, connection, creative, editable, analysis, analyze, audit, business, chart, element, management, part, report, research, result, statistics, stats, stacked, horizontal, bar, pie, comparing

Comparative Complex Chart PowerPoint Diagram

This PowerPoint diagram template has theme color applied. So when you do simple copying and pasting, the color will be applied automatically. In addition, shapes and text are 100% editable

This ‘Comparative Complex Chart PowerPoint Diagram’ Preview:

This template can be used for school classes, business purposes, and commercial purposes. However, this template cannot be distributed absolutely.
You May Also Like

Comparison Car Chart PowerPoint Diagram

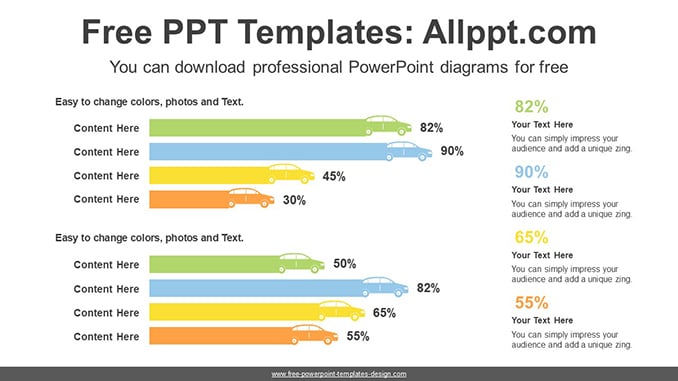
This diagram is a car bar chart comparing the two types. These bar charts help you visualize comparisons, such as two variations, growth rates. You can also modify data with simple formula input.

Search Keywords: PowerPoint, diagram, template, presentation, graph, graphic, icons, infographic, information, design, shape, creative, editable, analysis, analyze, audit, business, chart, part, report, research, statistics, stats, column, car, chart, bar, comparing

Comparison Car Chart PowerPoint Diagram

This PowerPoint diagram template has theme color applied. So when you do simple copying and pasting, the color will be applied automatically. In addition, shapes and text are 100% editable

This ‘Comparison Car Chart PowerPoint Diagram’ Preview:

This template can be used for school classes, business purposes, and commercial purposes. However, this template cannot be distributed absolutely.
You May Also Like

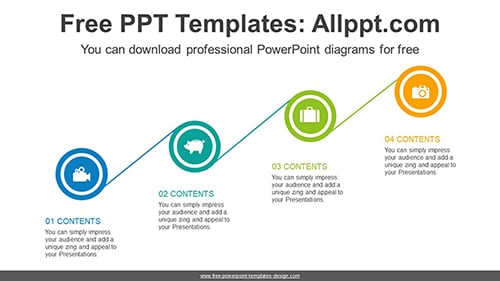
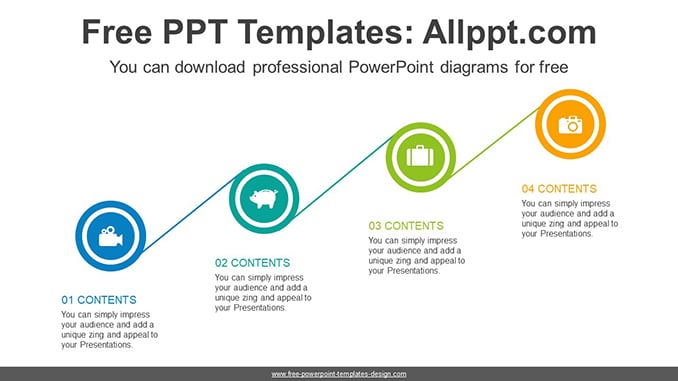
Horizontal Rounded Bar PowerPoint Diagram

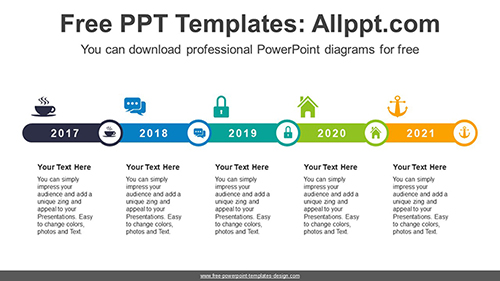
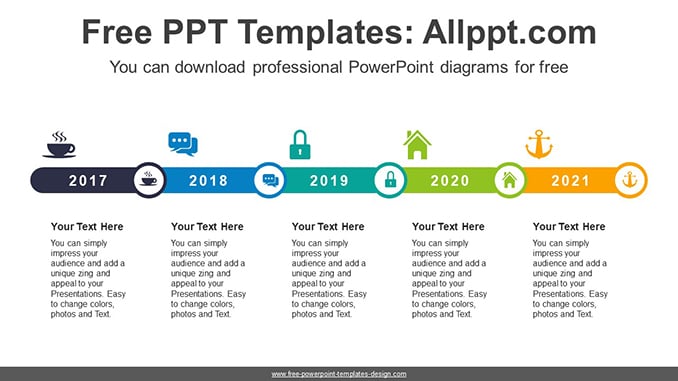
This diagram aligns round bars horizontally and points them in circles. Simple bars arranged in a date are joined to visualize the passage of time. It’s also an editable graphic with text and icon placeholders.

Search Keywords: template, infographic, graph, graphic, data, design, process, progress, set, shape, step, symbol, concept, connection, creative, editable, timeline, line, simple, horizontal, circles, bar, round

Horizontal Rounded Bar PowerPoint Diagram

This PowerPoint diagram template has theme color applied. So when you do simple copying and pasting, the color will be applied automatically. In addition, shapes and text are 100% editable

This ‘Horizontal Rounded Bar PowerPoint Diagram’ Preview:

This template can be used for school classes, business purposes, and commercial purposes. However, this template cannot be distributed absolutely.
You May Also Like

Target Bar Chart PowerPoint Diagram

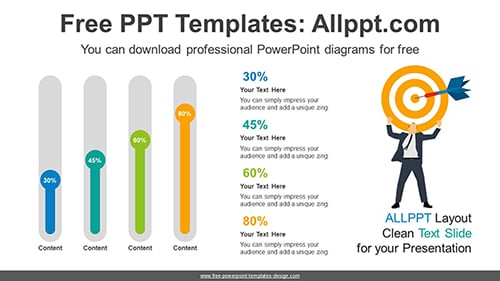
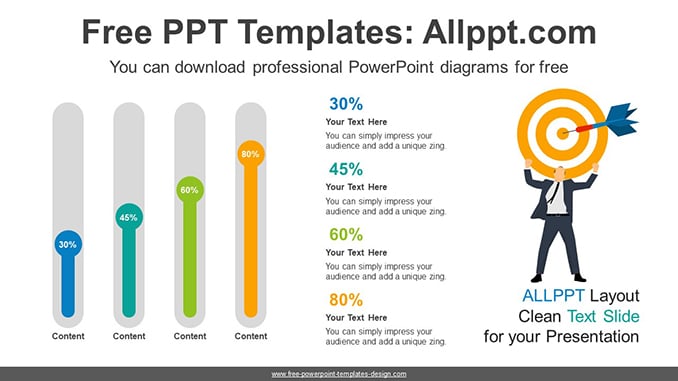
This diagram is a bar chart with a businessman with a target. This makes it easy to describe your data with simple charts and text lists. Bar charts allow you to easily adjust numeric values by entering formulas.

Search Keywords: diagram, template, presentation, graph, graphic, icons, infographic, information, idea, layout, data, design, process, progress, shape, step, symbol, concept, connection, creative, editable, analysis, analyze, audit, business, chart, element, management, part, report, research, result, statistics, stats, stacked, horizontal, bar, target, businessman

Target Bar Chart PowerPoint Diagram

This PowerPoint diagram template has theme color applied. So when you do simple copying and pasting, the color will be applied automatically. In addition, shapes and text are 100% editable

This ‘Target Bar Chart PowerPoint Diagram’ Preview:

This template can be used for school classes, business purposes, and commercial purposes. However, this template cannot be distributed absolutely.
You May Also Like

Funnel Bar Chart PowerPoint Diagram

This diagram is a bar chart with 5 levels of funnels. This makes it easy to describe your data with simple charts and text lists. Bar charts can easily adjust numeric values by entering formulas.

Search Keywords: diagram, template, presentation, graph, graphic, icons, infographic, information, idea, layout, data, design, process, progress, shape, step, symbol, concept, connection, creative, editable, analysis, analyze, audit, business, chart, element, management, part, report, research, result, statistics, stats, stacked, horizontal, bar, funnel, five

Funnel Bar Chart PowerPoint Diagram

This PowerPoint diagram template has theme color applied. So when you do simple copying and pasting, the color will be applied automatically. In addition, shapes and text are 100% editable

This ‘Funnel Bar Chart PowerPoint Diagram’ Preview:

This template can be used for school classes, business purposes, and commercial purposes. However, this template cannot be distributed absolutely.
You May Also Like

Rising Column Chart PowerPoint Diagram

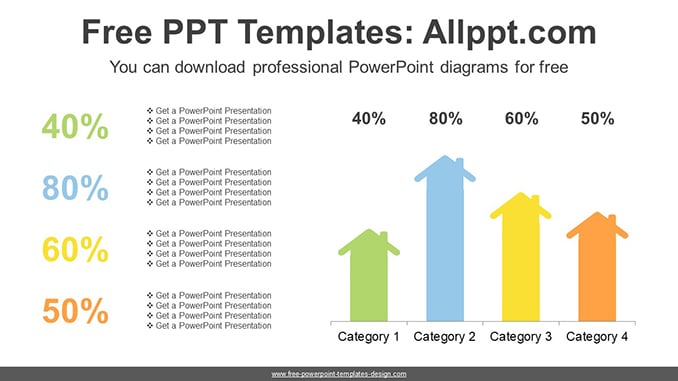
This diagram is a ribbon bar chart design that looks like rising from bottom to top. This makes it easy to describe your data with simple charts and text lists. This allows you to modify the data with simple numeric adjustments.

Search Keywords: PowerPoint, diagram, template, presentation, graph, graphic, icons, infographic, information, idea, layout, data, design, process, progress, shape, step, symbol, concept, connection, creative, editable, analysis, analyze, audit, business, chart, element, management, part, report, research, result, statistics, stats, explains, compares, ribbon, bar, rising, bent, top, bottom

Rising Column Chart PowerPoint Diagram

This PowerPoint diagram template has theme color applied. So when you do simple copying and pasting, the color will be applied automatically. In addition, shapes and text are 100% editable

This ‘Rising Column Chart PowerPoint Diagram’ Preview:

This template can be used for school classes, business purposes, and commercial purposes. However, this template cannot be distributed absolutely.
You May Also Like

Triangular Flow PowerPoint Template

This diagram is a template showing the triangular progress of a circle. Use it to emphasize the movement or direction of a process or workflow. It is also an editable graphic with text and icon placeholders.

Search Keywords: diagram, template, presentation, graph, graphic, icons, infographic, information, idea, layout, data, design, process, progress, shape, step, symbol, concept, connection, creative, editable, flow, list, horizontal, alignment, bar, workflow, arrow, oval, ellipse, circle, triangular

Triangular Flow PowerPoint Template

This PowerPoint diagram template has theme color applied. So when you do simple copying and pasting, the color will be applied automatically. In addition, shapes and text are 100% editable

This ‘Triangular Flow PowerPoint Template’ Preview:

This template can be used for school classes, business purposes, and commercial purposes. However, this template cannot be distributed absolutely.

You May Also Like