Posts

6-Division Radial Doughnut PPT Diagram

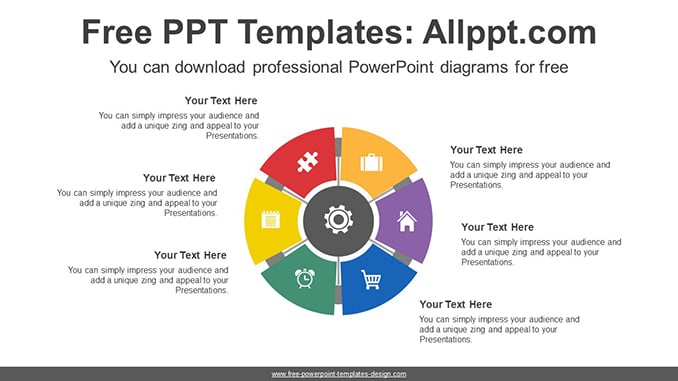
This diagram is a radial circle with a doughnut-shaped wheel. This explains the six information cycles and the results. It is also an editable graphic with text and icon placeholders.

Search Keywords: PowerPoint, diagram, template, presentation, graph, graphic, icons, infographic, information, idea, layout, data, design, process, progress, shape, step, symbol, concept, connection, creative, editable, choice, circle, circular, cycle, element, flat, report, section, concentrate, wheel, radial, circle, doughnut, six

6-Division Radial Doughnut PPT Diagram

This PowerPoint diagram template has theme color applied. So when you do simple copying and pasting, the color will be applied automatically. In addition, shapes and text are 100% editable

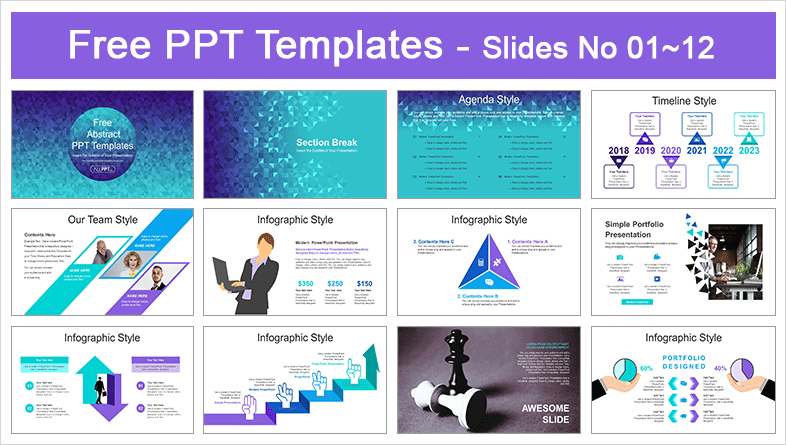
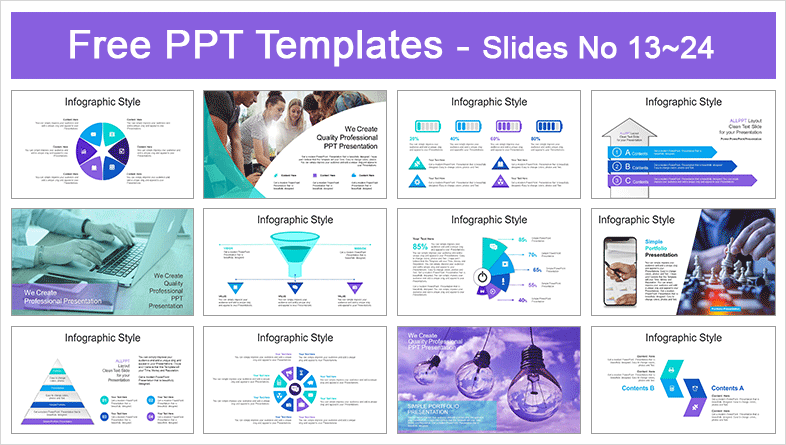
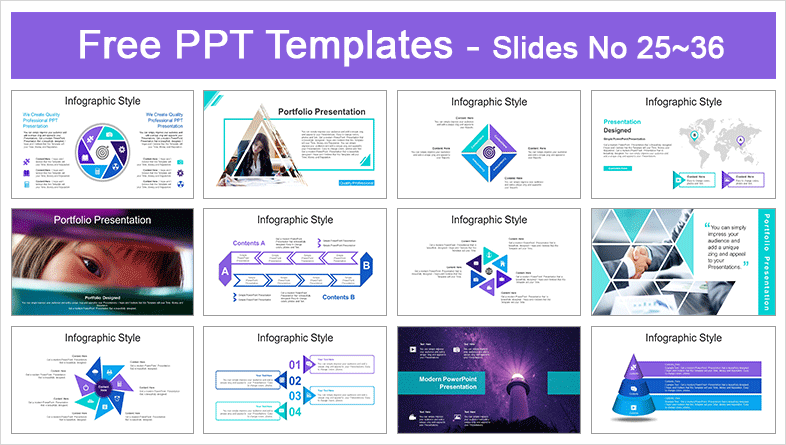
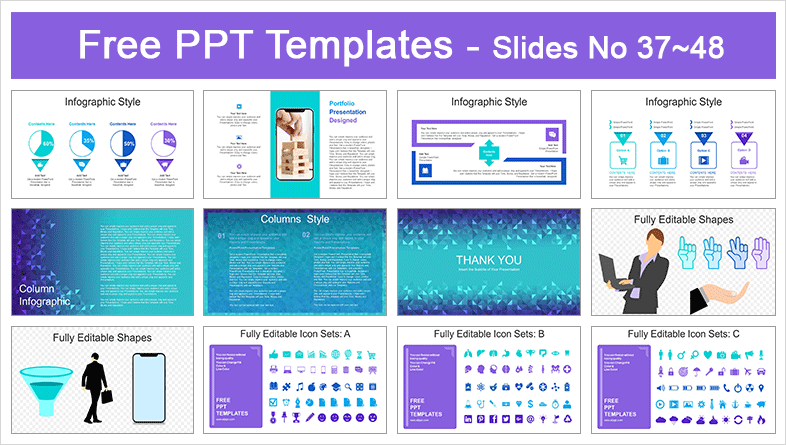
This ‘6-Division Radial Doughnut PPT Diagram’ Preview:

This template can be used for school classes, business purposes, and commercial purposes. However, this template cannot be distributed absolutely.

You May Also Like

Equalizer Placemark Charts PowerPoint Diagram

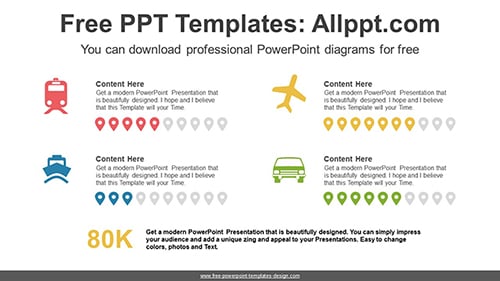
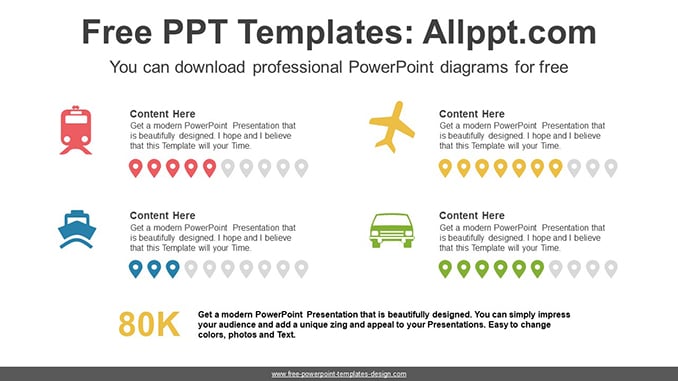
This diagram is four charts with placemarks arranged evenly. One placemark combination counts as 10% of 100%. You can display the desired value with the color change.

Search Keywords: PowerPoint, diagram, template, presentation, graph, icons, infographic, information, idea, graphic, data, design, process, progress, shape, step, concept, connection, creative, connected, editable, analysis, analyze, audit, business, chart, element, management, part, report, research, result, statistics, stats, equalizer, placemark, percent

Equalizer Placemark Charts PowerPoint Diagram

This PowerPoint diagram template has theme color applied. So when you do simple copying and pasting, the color will be applied automatically. In addition, shapes and text are 100% editable

This ‘Equalizer Placemark Charts PowerPoint Diagram’ Preview:

This template can be used for school classes, business purposes, and commercial purposes. However, this template cannot be distributed absolutely.

You May Also Like

Cascading Opacity Pie Chart PPT Diagram

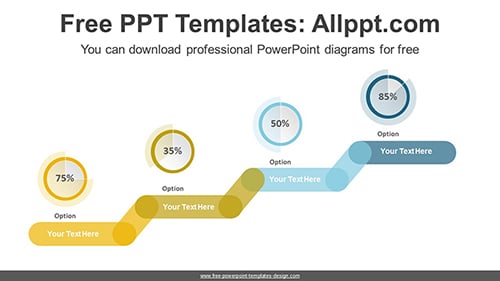
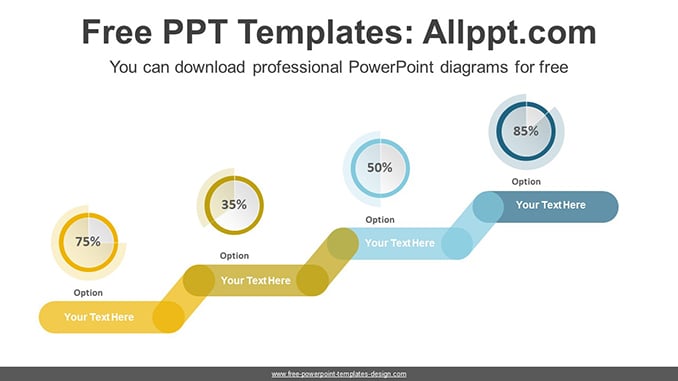
This diagram is a color opaque pie chart showing four data. Cascading colorful charts have a visual impact. It is also an editable graphic for text, charts, and icon placeholders. pie charts are easy to adjust numeric values with formula input.

Search Keywords:PowerPoint, diagram, template, presentation, graph, graphic, icons, infographic, information, idea, layout, data, design, process, progress, shape, step, symbol, concept, connection, creative, editable, analysis, analyze, audit, business, chart, element, management, part, report, research, result, statistics, stats, split, pie, circle, opaque, opacity, cascade, stair, step, rise

Cascading Opacity Pie Chart PPT Diagram

This PowerPoint diagram template has theme color applied. So when you do simple copying and pasting, the color will be applied automatically. In addition, shapes and text are 100% editable

This ‘Cascading Opacity Pie Chart PPT Diagram’ Preview:

This template can be used for school classes, business purposes, and commercial purposes. However, this template cannot be distributed absolutely.

You May Also Like

Six Pentagons PowerPoint Diagram

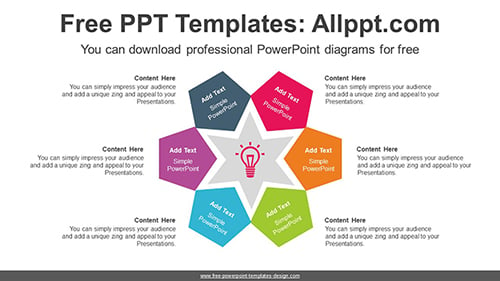
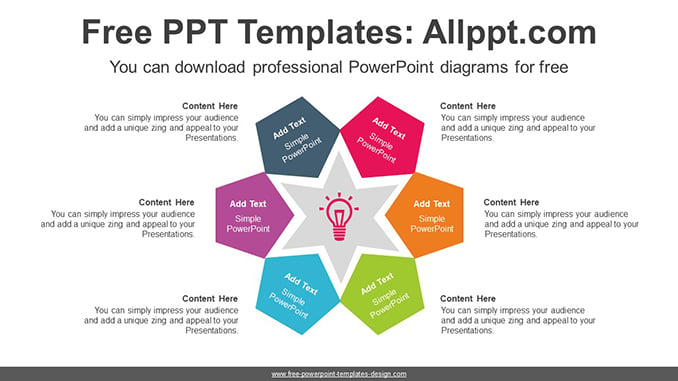
In this diagram, six pentagons come together to form a flower. This explains the six information cycles and the results. It is also an editable graphic with text and icon placeholders.

Search Keywords: PowerPoint, diagram, template, presentation, graph, graphic, icons, infographic, information, idea, layout, data, design, process, progress, shape, step, symbol, concept, connection, creative, editable, choice, circle, circular, cycle, element, flat, report, section, concentrate, six, pentagons, star, flower, bulb

Six Pentagons PowerPoint Diagram

This PowerPoint diagram template has theme color applied. So when you do simple copying and pasting, the color will be applied automatically. In addition, shapes and text are 100% editable

This ‘Six Pentagons PowerPoint Diagram’ Preview:

This template can be used for school classes, business purposes, and commercial purposes. However, this template cannot be distributed absolutely.

You May Also Like

Double Bar Chart PowerPoint Diagram

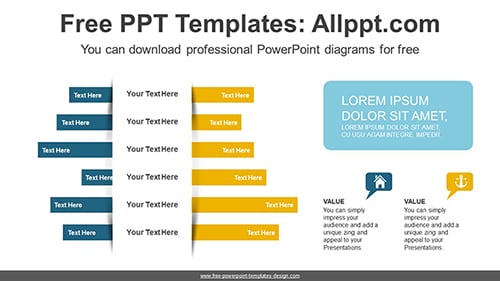
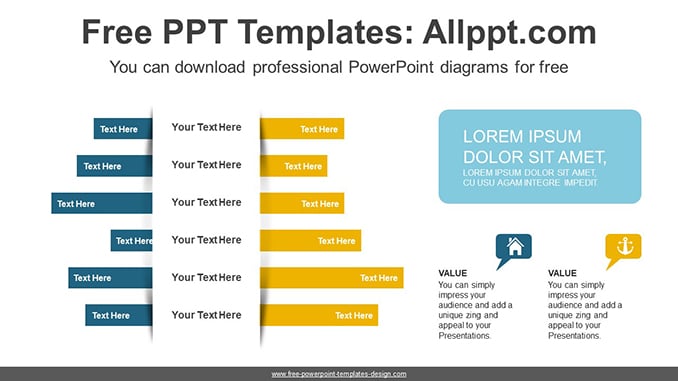
This chart type lets you add a layer of data to your visual analysis. You can compare multiple data sets on the same chart. This allows you to modify the data with simple numeric adjustments.

Search Keywords:diagram, template, presentation, graph, graphic, icons, infographic, information, idea, layout, data, design, process, progress, shape, step, symbol, concept, connection, creative, editable, analysis, analyze, audit, business, chart, element, management, part, report, research, result, statistics, stats, explains, compares, horizontal, bar, symmetrically, double

Double Bar Chart PowerPoint Diagram

This PowerPoint diagram template has theme color applied. So when you do simple copying and pasting, the color will be applied automatically. In addition, shapes and text are 100% editable

This ‘Double Bar Chart PowerPoint Diagram’ Preview:

This template can be used for school classes, business purposes, and commercial purposes. However, this template cannot be distributed absolutely.

You May Also Like

IoT Smart Control PowerPoint Diagram

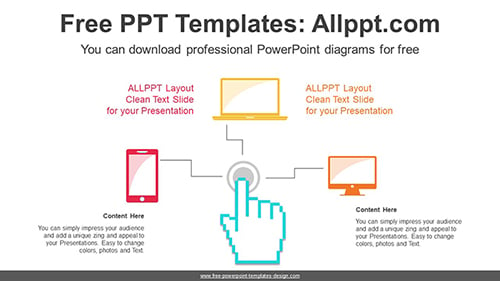
This diagram is designed for IoT control using smart devices. This is a good explanation of using the Internet of Things to control everything. It is also an editable graphic with text and icon placeholders.

Search Keywords:diagram, template, presentation, graph, graphic, icons, infographic, information, idea, layout, data, design, process, progress, shape, step, symbol, concept, connection, creative, editable, choice, circle, circular, cycle, element, flat, report, section, concentrate, four, circle, IoT, center, machine, smart, device, cellphone, computer, tab, tablet, pc, laptop, control, hand, button, operation

IoT Smart Control PowerPoint Diagram

This PowerPoint diagram template has theme color applied. So when you do simple copying and pasting, the color will be applied automatically. In addition, shapes and text are 100% editable

This ‘IoT Smart Control PowerPoint Diagram’ Preview:

This template can be used for school classes, business purposes, and commercial purposes. However, this template cannot be distributed absolutely.

You May Also Like

Gear Wheels Rotating PowerPoint Diagram

This template is a three-step infographic design with gearwheels. This explains the three information cycles and the results. It is also an editable graphic with text and icon placeholders.

Search Keywords: PowerPoint, Diagram, template, presentation, graph, graphic, icons, infographic, information, idea, layout, data, design, process, progress, shape, step, symbol, concept, connection, creative, editable, choice, circle, circular, cycle, element, flat, report, section, concentrate, wheel, radial, circle, rotating, belt, Gear

Gear Wheels Rotating PowerPoint Diagram

This PowerPoint diagram template has theme color applied. So when you do simple copying and pasting, the color will be applied automatically. In addition, shapes and text are 100% editable

This ‘Gear Wheels Rotating PowerPoint Diagram’ Preview:

This template can be used for school classes, business purposes, and commercial purposes. However, this template cannot be distributed absolutely.

You May Also Like

Five Doughnut Charts Diagram Template

This diagram is a design with five donut charts and an illustration of a woman and businessman working on a laptop. This makes it easy to describe the data with simple charts and text lists. Doughnut charts are easy to adjust numeric values with formula input.

Search Keywords: PowerPoint, diagram, template, presentation, graph, icons, infographic, information, idea, graphic, data, design, process, progress, shape, step, concept, connection, creative, connected, editable, analysis, analytics, analyze, audit, business, chart, circle, circular, donuts, doughnut, element, finance, graph, management, part, pie, report, research, result, round, statistics, stats, visualization, simple, woman, laptop, businessman, five, illustration

Five Doughnut Charts Diagram Template

This PowerPoint diagram template has theme color applied. So when you do simple copying and pasting, the color will be applied automatically. In addition, shapes and text are 100% editable

This ‘Five Doughnut Charts Diagram Template’ Preview:

This template can be used for school classes, business purposes, and commercial purposes. However, this template cannot be distributed absolutely.

You May Also Like

Radial Fan Shaped PowerPoint Diagram

This diagram is a design in which the sectors are gathered radially to form a star shape. This diagram can be used to describe ideas and concepts using six points. It is also an editable graphic with text and icon placeholders.

Search Keywords: PowerPoint, diagram, template, presentation, graph, graphic, icons, infographic, information, idea, layout, data, design, process, progress, shape, step, symbol, concept, connection, creative, editable, choice, circle, circular, cycle, element, flat, report, section, concentrate, star, donut, five, point, fan

Radial Fan Shaped PowerPoint Diagram

This PowerPoint diagram template has theme color applied. So when you do simple copying and pasting, the color will be applied automatically. In addition, shapes and text are 100% editable

This ‘Radial Fan Shaped PowerPoint Diagram’ Preview:

This template can be used for school classes, business purposes, and commercial purposes. However, this template cannot be distributed absolutely.

You May Also Like

Comparative Waterfall Chart PowerPoint Diagram

This is a diagram for comparison by placing two waterfall charts. This is a concise chart that fills the space so the data can be easily explained. Waterfall charts allow you to easily adjust numeric values by entering formulas.

Search Keywords: PowerPoint, diagram, template, presentation, graph, graphic, icons, infographic, information, idea, layout, data, design, process, progress, shape, step, symbol, concept, connection, creative, editable, analysis, analyze, audit, business, chart, element, management, part, report, research, result, statistics, stats, accounting, bar, improvement, increase, planning, positive, project, report, scale, score, statistic, waterfall

Comparative Waterfall Chart PowerPoint Diagram

This PowerPoint diagram template has theme color applied. So when you do simple copying and pasting, the color will be applied automatically. In addition, shapes and text are 100% editable

This ‘Comparative Waterfall Chart PowerPoint Diagram’ Preview:

This template can be used for school classes, business purposes, and commercial purposes. However, this template cannot be distributed absolutely.

You May Also Like